







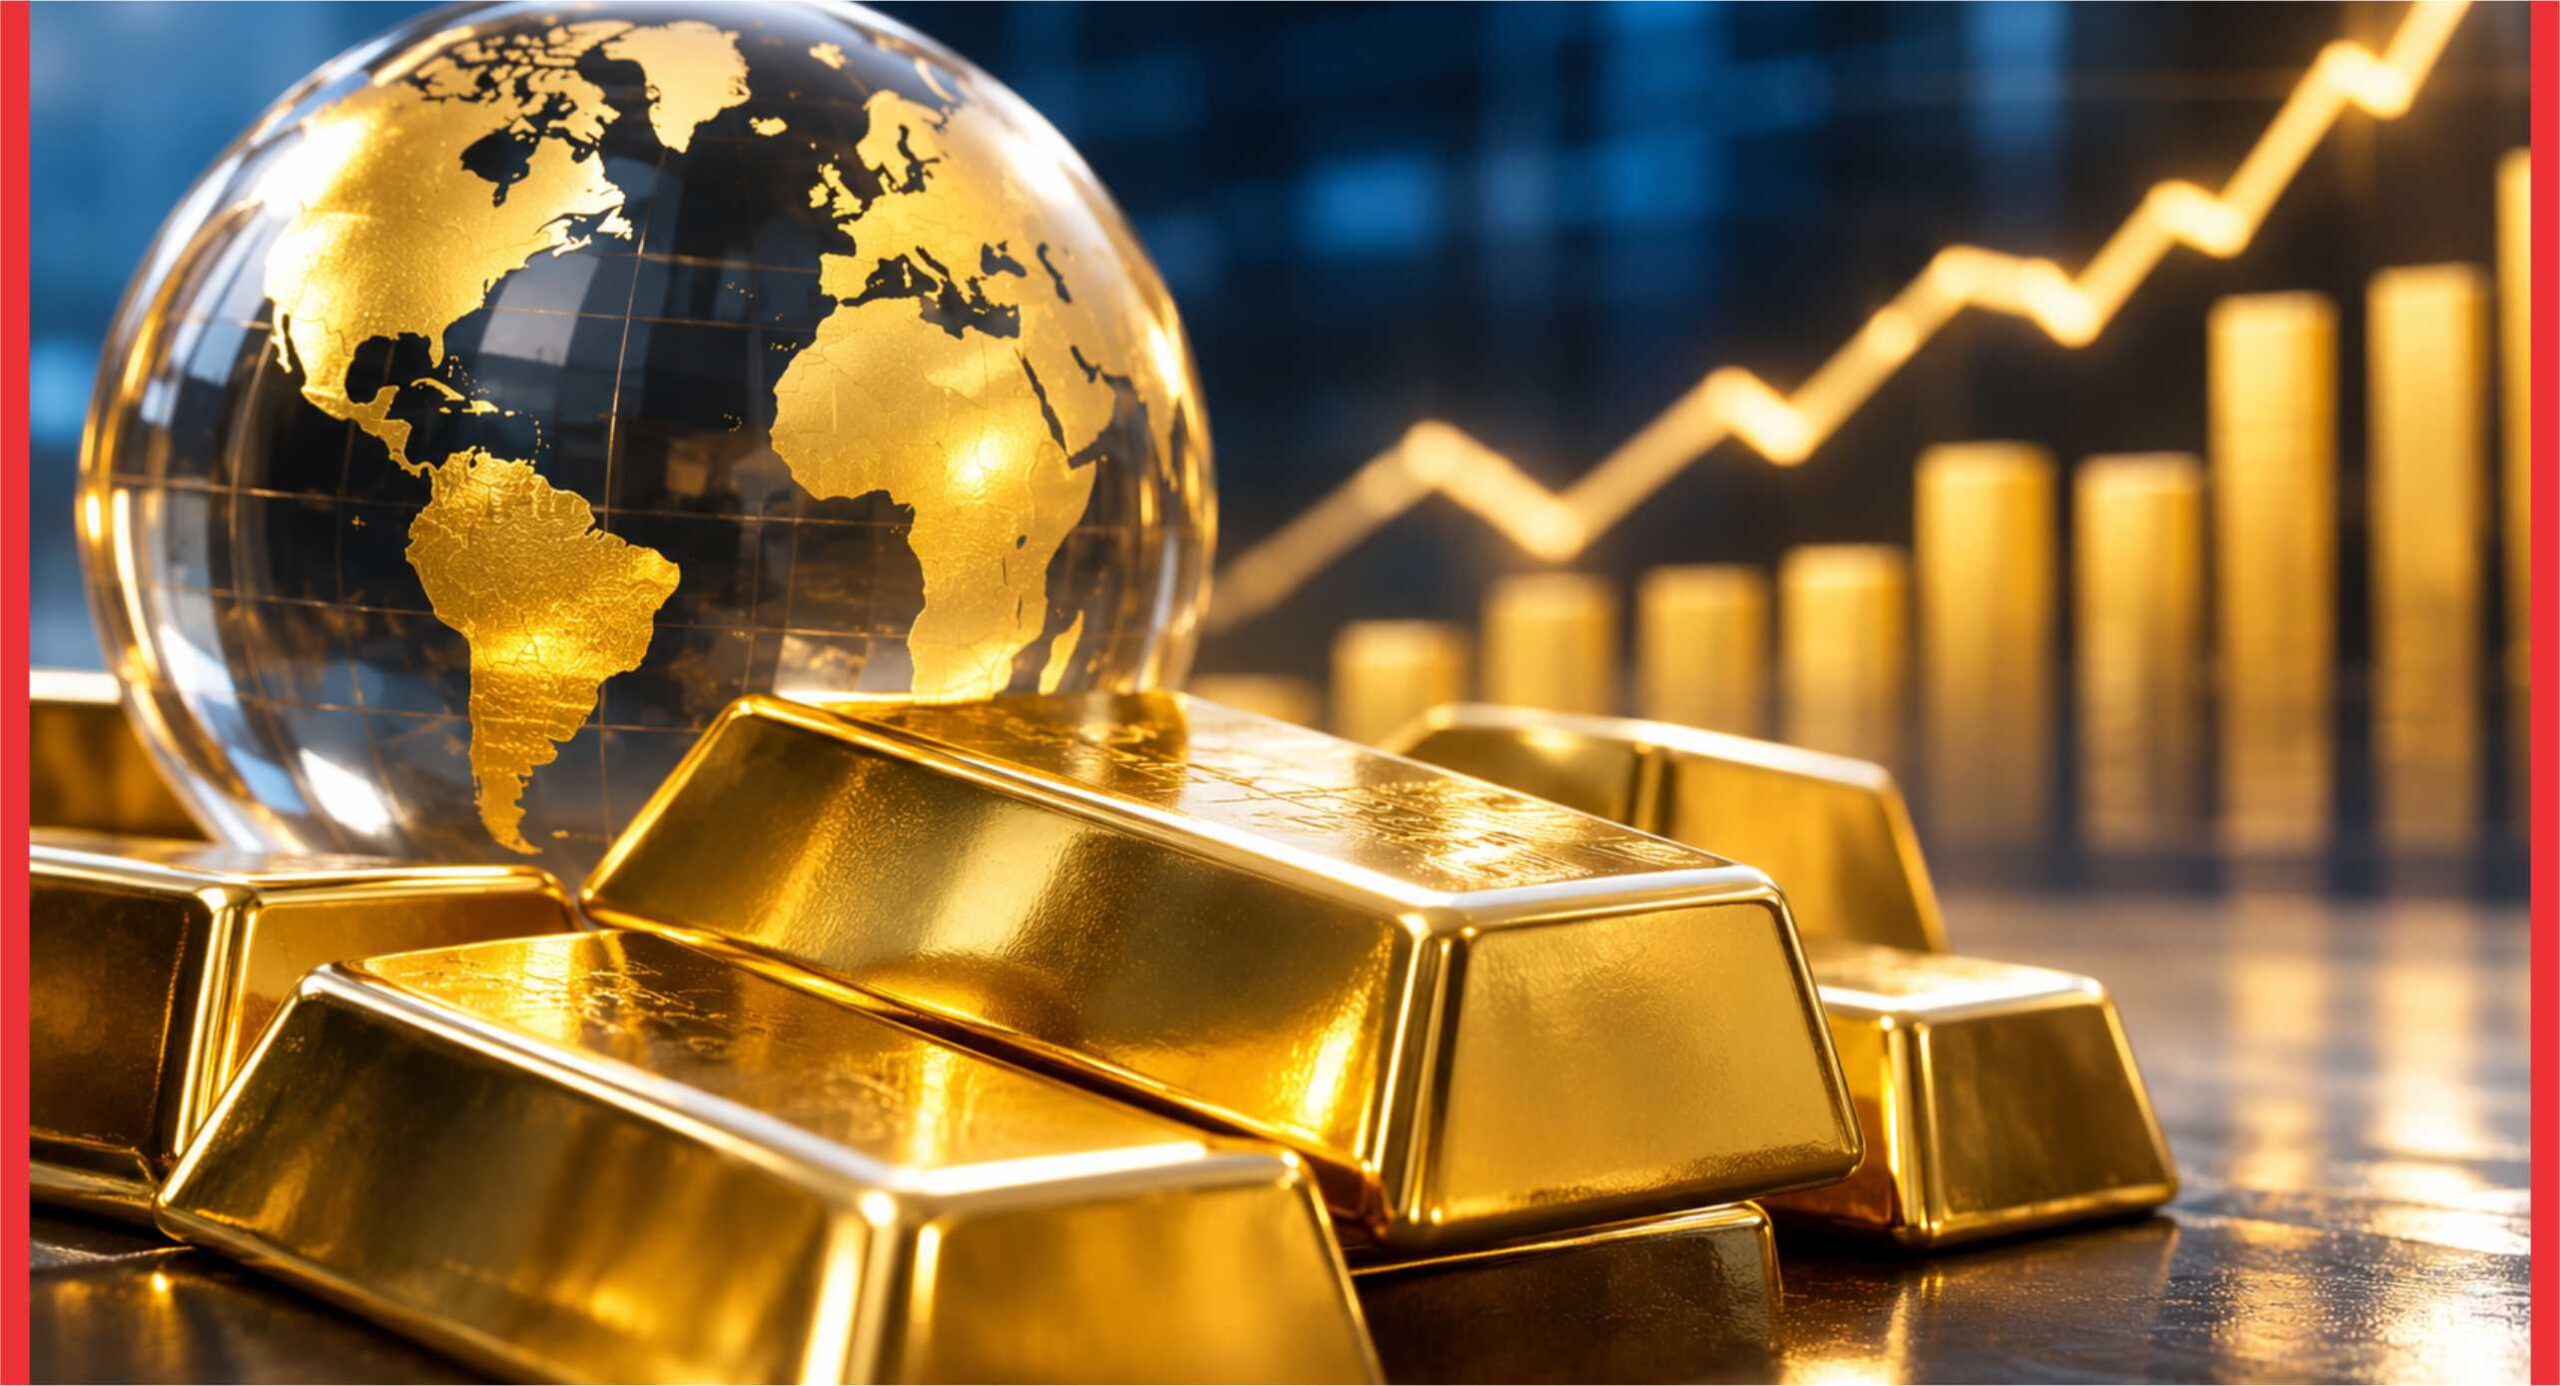
Global gold demand remained close to record levels in the third quarter of 2026, supported by stronger central bank purchases and renewed inflows into gold-backed exchange-traded funds (ETFs), even as high prices weakened jewelry and physical investment demand.
The World Gold Council’s Gold Demand Trends: Q3 2026 report shows that total global gold demand, including over-the-counter (OTC) investment, reached 1,369 tons, down 1% year-on-year. However, demand for the first nine months stood at 3,881 tons, virtually matching the record 3,884 tons recorded over the corresponding period in 2025.
The value of global gold demand reached a record US$566 billion in the first three quarters of 2026, reflecting the impact of elevated gold prices.
The average LBMA (PM) gold price rose to US$4,262.20 per ounce in Q3, representing a 23% increase year-on-year. It was the third-highest quarterly average on record.
Central banks strengthen gold purchases
Purchases by central banks and other institutions increased to 321.2 tons, up 42% from 226.3 tons in Q3 2025. The figure also exceeded the recent typical quarterly buying levels and brought year-to-date purchases to 675 tons, 6% higher than the same period last year.
The rebound suggests that official institutions continue to view gold as an important reserve asset amid concerns over inflation, fiscal sustainability and broader financial market risks.
Gold-backed ETFs also returned to positive territory, recording net inflows of 211.2 tons in Q3 after outflows of 47.3 tons in Q2. The World Gold Council attributed the renewed interest partly to growing concerns about fiscal sustainability and inflation.
Physical investment demand weakens
Unlike institutional investors, individual investors reduced their physical gold purchases during the quarter.
Global bar and coin demand declined 19% year-on-year to 267.8 tons, compared with 328.6 tons in Q3 2025. Demand for gold bars fell 19% to 202.7 tons, while official coin demand increased 12% to 35.3 tons.
Overall investment demand, including ETFs, bars and coins, reached 479 tons, down 14% year-on-year. The strong ETF recovery was therefore insufficient to offset weaker physical investment demand.
Jewelry demand takes a hit from high prices
Global jewelry consumption fell 17% year-on-year to 312.9 tons, while jewelry fabrication declined 19% to 340.1 tons. The World Gold Council identified persistently high prices as the major constraint on demand.
Despite lower volumes, the value of jewelry demand increased 2% year-on-year to US$43 billion. This indicates that higher prices partly offset the decline in physical purchases.
Technology provided a more positive picture. Gold demand from the technology sector increased 3% to 84.8 tons, supported by stronger electronics manufacturing. Electronics demand rose 5% to 72.5 tons, with AI-related manufacturing contributing to the increase.
Gold supply: Mine production rises as recycling declines
Global gold supply declined 1% year-on-year to 1,368.6 tons in Q3 2026, despite higher mine production.
Mine output increased 3% to 1,070.9 tons, marking a third-quarter record. On a quarterly basis, production increased 13% from Q2 2026.
However, recycled gold supply fell 8% year-on-year to 314.5 tons, its lowest level in three years. The decline suggests that higher gold prices have not generated a corresponding increase in the volume of gold returning to the market.
Net producer hedging remained negative at -16.8 tons.
The supply figures indicate that mine production remains the principal source of potential growth, while recycling continues to respond weakly to elevated prices.
Key gold demand and supply statistics
The following figures are extracted from the World Gold Council’s Q3 2026 supply and demand table.
| Indicator | Q3 2026 | YoY change |
| Total gold demand | 1,368.6 tons | -1% |
| Central bank purchases | 321.2 tons | +42% |
| Gold ETFs | 211.2 tons | —* |
| Bar and coin demand | 267.8 tons | -19% |
| Jewelry consumption | 312.9 tons | -17% |
| Technology demand | 84.8 tons | +3% |
| Total gold supply | 1,368.6 tons | -1% |
| Mine production | 1,070.9 tons | +3% |
| Recycled gold | 314.5 tons | -8% |
*The Q3 ETF comparison is not expressed as a conventional percentage because the previous year’s quarterly flow was positive while Q2 2026 recorded outflows. Source: World Gold Council, Gold Demand Trends Q3 2026.
Market outlook: Central banks and ETFs remain key demand drivers
The World Gold Council expects investment demand to remain relatively resilient through the remainder of 2026, although investors will continue to respond to competing market forces.
Central bank purchases are expected to at least match 2025 levels, following the stronger-than-anticipated buying in Q3. Demand for ETFs, bars and coins is also expected to remain supported, although uncertainty over gold prices could influence retail investment decisions.
Jewelry consumption is likely to remain under pressure as elevated prices continue to affect affordability. Recycling, meanwhile, is expected to remain broadly unresponsive to high prices.
On the supply side, the Council sees mine production as the only likely source of modest growth.
BuyerMetrics Market Perspective
The Q3 figures reveal an increasingly important distinction between institutional and consumer demand for gold.
Central banks and ETF investors are providing strong support for the market, while jewelry buyers and physical retail investors are becoming more cautious as prices remain elevated.